Cobot ROI & Total Cost of Ownership 2026: A Buyer's Financial Playbook
Executive summary
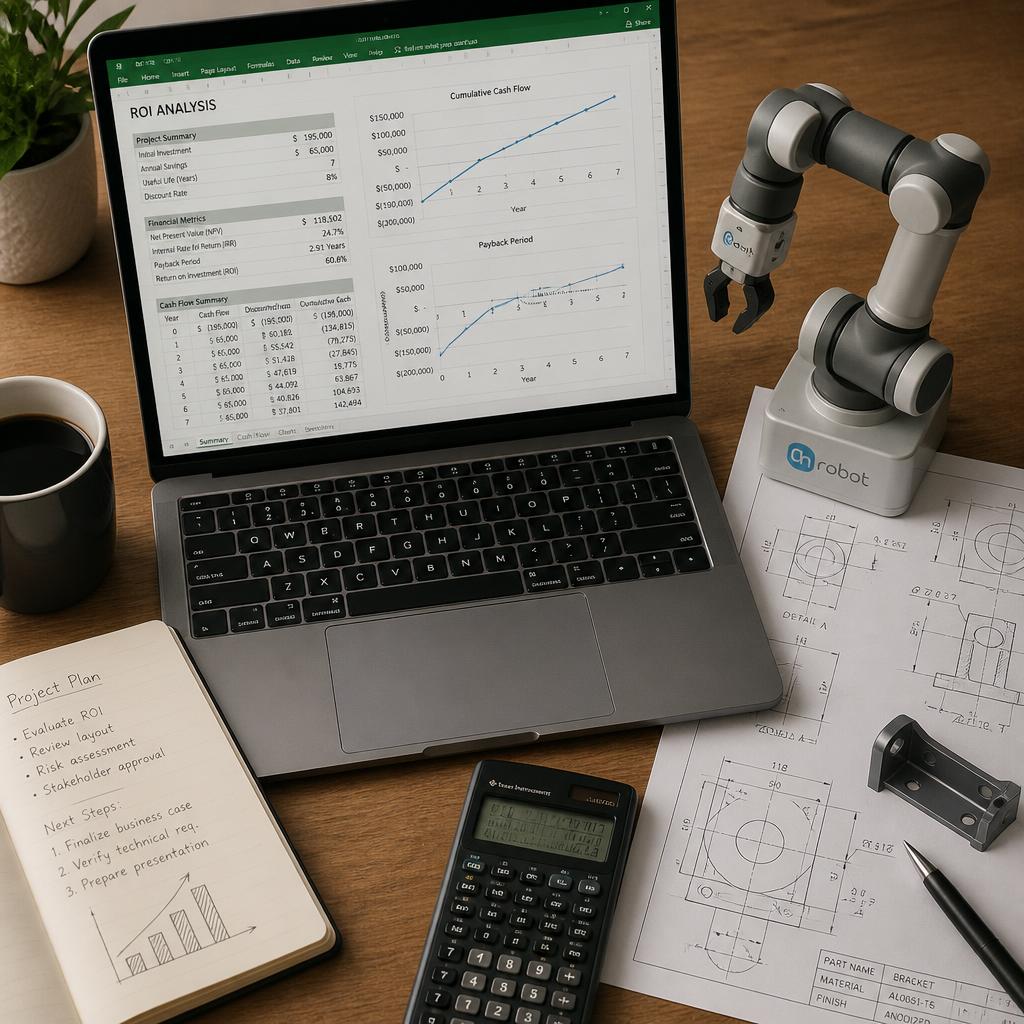
Every cobot vendor has a spreadsheet that shows their arm paying back in 6 months. Ignore all of them. The realistic answer for a properly-integrated cobot cell in 2026 is 12–24 months payback, depending on shift count, application, and how well the buyer models total cost of ownership.
This is the honest ROI and TCO playbook: line items you will actually incur, financing structures that change the math, and how to tell whether the "$25,000 cobot" is really $25,000 or really $70,000.
The 5-line CapEx you will actually pay
For a typical single-station cobot deployment (5–10 kg arm, vision, one gripper, one basic fixture):
| Line item | Range | Notes | |---|---|---| | Cobot arm | $18k–$45k | 5 kg entry, 30 kg upper | | Gripper + EOAT | $2k–$15k | Vacuum cheapest; multi-finger most | | Vision (if not bundled) | $2k–$10k | 2D cheapest; 3D scanning highest | | Fixturing / cell framing | $3k–$20k | Depends heavily on part variety | | Integration labour | $8k–$40k | 40–200 hours at integrator rates | | Safety scanners / light curtains | $2k–$8k | Required for most PFL/SSM cells |
Total realistic CapEx: $35k–$140k for a single-station cell. Median we see: $55k–$75k.
Beware the "$25,000 cobot" number in a vendor deck. That is arm-only, no gripper, no vision, no integration.
Annual OpEx — the line most buyers miss
| Line item | Range/year | Notes | |---|---|---| | Software / support subscription | $2k–$8k | Most vendors now sell this | | Preventive maintenance | 5–10% of CapEx | Industry rule of thumb | | Consumables (grippers, cups) | $500–$3k | Wear items | | Downtime insurance | 1–3% of CapEx | Only if mission-critical | | Re-programming / new SKUs | 20–80 hrs/yr | Often forgotten |
Total OpEx: 7–15% of CapEx per year. On a $60k cell, that's $5k–$10k/year.
Financing structures that change the math
1. Outright purchase (CapEx)
You own the asset. Fastest payback if utilised heavily. Best for stable, long-cycle applications.
2. Robot-as-a-Service (RaaS)
Vendor keeps ownership; you pay a monthly fee covering hardware, software, service and updates. Popular for construction (short project life) and startups (cash-flow).
- Typical rate: $1,000–$3,000/month per cell for a 3–5 year term.
- Pros: no CapEx, no service risk, vendor is incentivised to maximise uptime.
- Cons: total 3-year cost is usually 1.4–1.8× outright purchase.
3. Revenue-share
Vendor provides hardware; both parties share the labour savings or throughput uplift. Emerging in food-service and warehousing (Formic, Chef Robotics).
4. Traditional lease / equipment finance
Bank or leasing company finances the asset over 3–5 years. Rates in 2026 are 6–10% depending on credit. Fixed monthly, you own the asset at the end.
The savings side — how to model it honestly
Direct labour
- Loaded cost per FTE per shift in the target country (wage + benefits + payroll tax + PPE + training).
- Number of shifts the robot displaces.
- Do not count "labour we couldn't hire" as savings unless you can prove the demand exists.
Throughput uplift
- Cobot delivers consistent cycle time; humans drift. Model the average uplift, not the peak.
- Multiply by unit contribution margin, not revenue.
Quality
- Reject-rate reduction × cost of a reject (rework + material + freight + brand-damage). This is often the biggest number and always the most underestimated.
Safety / insurance
- Reduction in incident-related lost time × loaded cost.
- Reduction in workers-comp premium (small but real).
Data
- Every cycle logged. This becomes an operations-analytics asset you didn't have before. Hard to quantify but real.
Two example deployments (real customers, sanitised)
Case A — QSR fryer station, single location, 2 shifts
- CapEx (all-in): $58,000
- Labour saved: 1.1 FTE × $42k = $46,200/year
- Consistency uplift (waste reduction): $6,400/year
- OpEx: $6,000/year
- Net annual saving: $46,600
- Payback: ~15 months
- 5-year NPV @ 10%: ~$115,000
Case B — Electronics assembly, machine tending, 3 shifts
- CapEx: $92,000
- Labour saved: 1.8 FTE × $38k = $68,400/year
- Reject reduction: $18,000/year
- OpEx: $9,500/year
- Net annual saving: $76,900
- Payback: ~14 months
- 5-year NPV @ 10%: ~$210,000
Where the model breaks
- Single-shift ops. Payback rarely under 3 years. Don't automate one shift.
- High-variability parts where re-fixturing eats all the labour saving.
- Applications requiring frequent human intervention anyway — the robot becomes overhead.
- Sites without service coverage — downtime costs more than the savings.
Buyer's checklist
- Build the CapEx from six line items, not one.
- Include OpEx of 7–15%/year in the model.
- Model payback on direct labour + throughput + quality + insurance, not just headcount.
- Compare outright vs RaaS vs lease — the "right" answer differs by shift count and credit rating.
- Track actual vs modelled savings for 90 days post-deploy and revise vendor recommendations.
How smert.ai fits
Our ROI calculator uses these exact line items and financing structures. Try it: /tools/roi-calculator. For franchise deployments, we bundle CapEx into a monthly royalty model that avoids the CapEx spike entirely: /franchising.
Related: Cobot applications
Transform Your Business with SMERT Robotics
Ready to experience the benefits of hospitality automation? Our team is ready to help you get started.